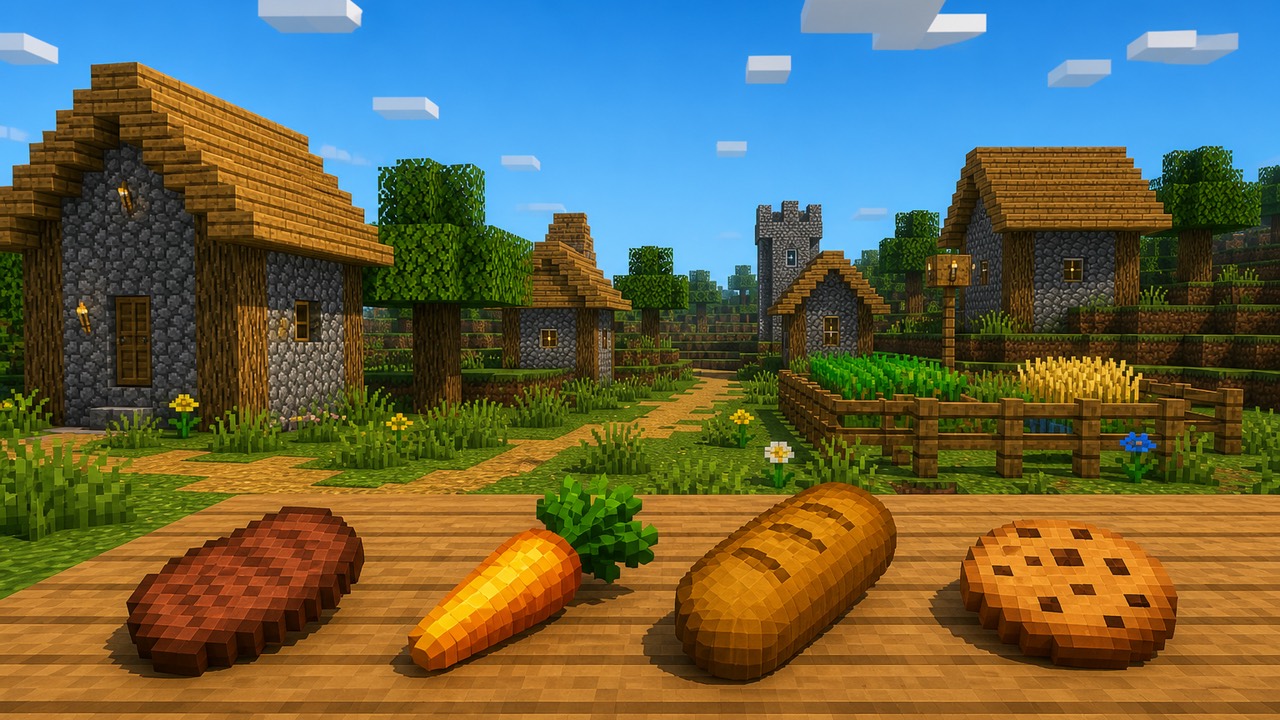

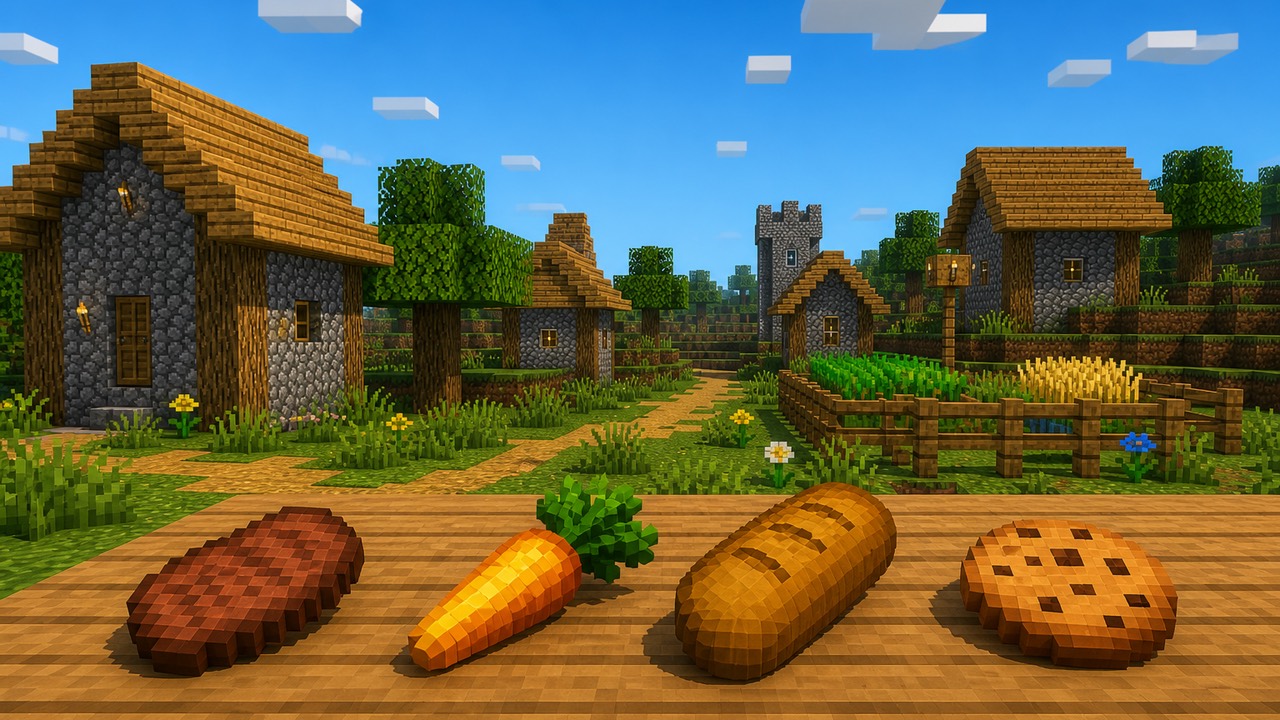
Golden carrot vs steak
~35× vs ~6×
Hunger restored per 100 real calories, using the same 100-gram kitchen rule. The golden carrot is far more generous than steak.
Full hunger tank sprint
1,360 m
Continuous sprint from a full hunger and saturation tank until you cannot sprint anymore.
I match each Minecraft food to 100 grams of a real kitchen food, then rank how much hunger and saturation you get per real calorie. Not a meal plan.
The hunger bar decides how far you can sprint and fight. Next to kitchen calories, some staples look fair and some look wildly off.
Golden carrots look wildly generous. Cookies barely register.
You eat a golden carrot and keep sprinting. You eat a cookie from the same hotbar and the hunger bar barely moves.
I wanted to know how those two snacks look next to real kitchen calories. Under one 100-gram kitchen rule, a golden carrot restores about 35 saturation points per 100 real calories. A steak restores about 6, and a cookie restores about 0.08.
The golden carrot is far more generous than steak. The cookie is almost empty in-game even though it is dense in the kitchen.
In-game the golden carrot restores 6 hunger and a chart-topping 14.4 saturation: elite sprint fuel. In the kitchen I only count a carrot (~41 kcal per 100 g). The gold is a crafting story, not food chemistry.
Chocolate-chip cookie rows in official U.S. food data sit near 492 kcal/100 g: serious energy density. Vanilla treats a cookie like a shrug (2 hunger, 0.4 saturation). Cake slices join the same club (389 kcal/100 g, same tiny game restore).
Saturation per 100 real calories (same 100-gram rule)
Higher = more Minecraft saturation per unit of real kitchen energy. Same 100 g portion rule on every bar.
| Ranking | Minecraft food | Hunger / sat | kcal @ 100 g | Sat / 100 kcal |
|---|---|---|---|---|
| Most “Minecraft” | Golden carrot | 6 / 14.4 | 41 (carrot only) | ~35.1 |
| Still skewed | Golden apple | 4 / 9.6 | 52 (apple only) | ~18.5 |
| Fair-ish protein | Steak | 8 / 12.8 | 212 | ~6.0 |
| Fair-ish protein | Cooked porkchop | 8 / 12.8 | 209 | ~6.1 |
| Least “Minecraft” | Cookie | 2 / 0.4 | 492 | ~0.08 |
| Also undervalued | Cake (one slice) | 2 / 0.4 | 389 | ~0.10 |
The golden carrot lands at about 35.1 saturation points per 100 real calories. The cookie lands at about 0.08. Divide the golden carrot by steak (about 6.0) and you get roughly 5.8× more Minecraft fullness per kitchen calorie, counting only the carrot and not the gold.
Steak is one of the fairer matches
Steak is high hunger, high saturation, and high real energy density. That is not the same mismatch as a carrot in gold foil out-sustaining a T-bone on kitchen physics. Players keep steak (and porkchop) as endgame staples for a reason the numbers still respect.
Minecraft tracks hunger, not kitchen calories. A 20-point hunger bar and a hidden saturation value that drains first. Saturation is closer to “how long until the bar jitters” than to a lab calorie count. I compare the two labeled systems rather than converting one into the other.
Hunger per 100 real calories (same 100-gram rule)
High = fills the visible bar cheaply in kitchen energy. Produce climbs. Cookie sinks.
Mushroom stew lands near the top only because I used a low-density cream soup stand-in (39 kcal/100 g). A meaty homemade stew would drop. Dried kelp used wet laver; a dry-seaweed row would climb density and crush the “efficiency” mirage. I keep them labeled, not headline heroes.
Where do the other foods land?
One weight rule for every food. I ranked 29 comparable foods on named official U.S. food rows. Notes where the stand-in is a stretch.
| Minecraft | H | S | Real stand-in | kcal/100 g | H/100 kcal | S/100 kcal | Note |
|---|---|---|---|---|---|---|---|
| Golden carrot | 6 | 14.4 | Carrots, raw | 41 | 14.63 | 35.12 | Gold excluded from kcal |
| Mushroom stew | 6 | 7.2 | Cream of mushroom soup, prepared | 39 | 15.38 | 18.46 | Low-confidence stand-in |
| Golden apple | 4 | 9.6 | Apples, raw, with skin | 52 | 7.69 | 18.46 | Gold + effects out of scope |
| Carrot | 3 | 3.6 | Carrots, raw | 41 | 7.32 | 8.78 | |
| Apple | 4 | 2.4 | Apples, raw, with skin | 52 | 7.69 | 4.62 | Medium apple ~182 g ≈ 95 kcal if you drop the fixed-mass rule |
| Melon slice | 2 | 1.2 | Watermelon, raw | 30 | 6.67 | 4.00 | |
| Baked potato | 5 | 6.0 | Potato, baked, flesh and skin | 93 | 5.38 | 6.45 | |
| Cooked cod | 5 | 6.0 | Cod, Atlantic, cooked | 105 | 4.76 | 5.71 | |
| Cooked porkchop | 8 | 12.8 | Pork center loin chop, cooked | 209 | 3.83 | 6.12 | |
| Steak | 8 | 12.8 | Top sirloin steak, cooked broiled | 212 | 3.77 | 6.04 | |
| Cooked chicken | 6 | 7.2 | Chicken breast, roasted | 165 | 3.64 | 4.36 | |
| Cooked salmon | 6 | 9.6 | Salmon, Atlantic, farmed, cooked | 206 | 2.91 | 4.66 | |
| Cooked mutton | 6 | 9.6 | Lamb, ground, cooked | 283 | 2.12 | 3.39 | Species stand-in |
| Cooked rabbit | 5 | 6.0 | Rabbit, cooked | 197 | 2.54 | 3.05 | |
| Bread | 5 | 6.0 | White bread | 266 | 1.88 | 2.26 | |
| Pumpkin pie | 8 | 4.8 | Pumpkin pie, commercial | 243 | 3.29 | 1.98 | High H, softer S |
| Honey bottle | 6 | 1.2 | Honey | 304 | 1.97 | 0.40 | Bottle volume ≠ 100 g |
| Sweet berries | 2 | 0.4 | Blueberries, raw | 57 | 3.51 | 0.70 | Berry stand-in |
| Dried kelp | 1 | 0.6 | Seaweed, laver, raw | 35 | 2.86 | 1.71 | Wet stand-in; dry seaweed denser |
| Raw beef | 3 | 1.8 | Ground beef 80/20, raw | 254 | 1.18 | 0.71 | |
| Raw chicken | 2 | 1.2 | Chicken meat+skin, raw | 215 | 0.93 | 0.56 | Also: Hunger effect in-game |
| Cake slice | 2 | 0.4 | Chocolate cake w/ frosting | 389 | 0.51 | 0.10 | |
| Cookie | 2 | 0.4 | Chocolate chip cookie | 492 | 0.41 | 0.08 |
Compact set shown here. Apple “medium” portion (182 g) is a real official portion if you want a natural-unit aside. It is not the ranking model.
See also
How far can a full hunger bar sprint?
Behind the drumsticks is a hidden exhaustion meter. Every 4.0 exhaustion burns 1 saturation, then 1 hunger once saturation is gone. Pure sprint costs about 0.1 exhaustion per meter, which works out to about 40 meters per point spent.
Sprint requires hunger above 6. Walking (after 1.11) does not spend exhaustion. So you cannot sprint the bar to zero. You sprint until the lock.
Start full (hunger 20, saturation 20) and you get about 1,360 meters of continuous sprint before you cannot sprint anymore. That’s 800 meters while saturation burns, then 560 meters while hunger drops from 20 to 6. The leftover 6 hunger cannot be pure-sprinted away.
Fresh spawn is hungrier than it looks: hunger 20, saturation 5, so about 760 meters of continuous pure sprint.
Pure-sprint meters from a topped bar (idealized one-item top-off)
Same exhaustion math, different foods. Assumes you ate into empty saturation and filled hunger to 20. Mechanical upper bounds, not tracked play sessions.
After an idealized top-off, a golden carrot is about 1,136 meters of pure sprint. Steak is about 1,072. A cookie is about 576. The bar still likes the carrot. The kitchen still likes the cookie.
No kitchen assumption required. If the calorie map ever fights you, these meters still stand.
Raw food: cook the chicken
Vanilla risks are combat debuffs. Real risk is food safety. I only need the hits players already know: cook the chicken, skip the rotten flesh.
| Minecraft | In game | Real world (plain language) |
|---|---|---|
| Raw chicken | Chance of Hunger status | Undercooked poultry can carry germs (official U.S. health guidance highlights Salmonella / Campylobacter). Cook poultry thoroughly. |
| Rotten flesh | High chance of Hunger | Spoiled meat is not a strategy. Don’t eat it. |
| Pufferfish | Poison + Nausea + Hunger package | Wrongly prepared pufferfish can mean tetrodotoxin. Medical emergency territory (official U.S. food-safety framing). |
| Spider eye | Poison | Not food. |
Furnaces, smokers, and campfires are the rare case where best practice in-game and IRL agree without an argument.
If you care about sprint time, steak and golden carrots earn their hotbar slots. Cookies are a kitchen snack, not a tank refill. A full bar still sprints about 1,360 meters before the lock.
How I calculated it
Game values. Hunger and saturation from minecraft.wiki/w/Food Food hunger / Food saturation tables (Java-facing numbers I use here).
Real energy. USDA FoodData Central SR Legacy package (2018-04 CSV download). Energy = nutrient number 208 (kcal). Each analogue has an FDC ID: golden carrot / carrot 170393; mushroom stew 172915; golden apple / apple 171688; melon 167765; baked potato 170093; cooked cod 171956; cooked porkchop 167827; steak 169457; cooked chicken 171477; cooked salmon 175168; cooked mutton 172544; cooked rabbit 172522; bread 174924; pumpkin pie 172787; honey 169640; sweet berries 171711; dried kelp 168458; raw beef 174036; raw chicken 171447; cake slice 174934; cookie 172716.
Metrics (100 g model).
Hunger per 100 kcal = hunger ÷ kcalitem × 100.
Saturation per 100 kcal = saturation ÷ kcalitem × 100.
kcal per hunger point = kcalitem ÷ hunger.
With the same assumed mass on every row, reordering mass for everyone
(all 85 g, all 100 g, all 200 g) keeps rank order the same.
Steak mass sensitivity (illustration only. Not a Mojang weight). FDC 169457 cooked top sirloin: 212 kcal/100 g. At 85 g (a common cooked-meat label scoop) ≈ 180 kcal. At 100 g = 212 kcal. At 225 g ≈ 477 kcal. USDA also lists a “1 steak” yield portion at 384 g (≈814 kcal). Proof that “one steak” in the real world is a portion description, not a Minecraft constant.
Gold rule. Golden carrot and golden apple kitchen energy = the produce only (carrot / apple). Metal is flavor, not calories.
Out of the ranking. Rabbit stew (multi-ingredient), rotten flesh, spider eye, pufferfish. Weak proxies (mushroom stew ≠ cream soup forever; dried kelp ≠ wet laver forever; berries ≈ blueberries; mutton ≈ ground lamb) stay in the table but get confidence notes.
Mojang never weighed a Minecraft steak. Any calorie number inherits my 100 g mass rule and my official U.S. food pick. Rankings stay honest under that rule. Absolute “Steve’s dinner is X calories” claims only live inside it. Not medical advice. Not a meal plan for you.
Sources & notes
Game rules
- Minecraft Wiki. Food (hunger, saturation, exhaustion, sprint rules): minecraft.wiki/w/Food
Nutrition records
- USDA FoodData Central. SR Legacy download used for locked FDC IDs and energy (nutrient 208): fdc.nal.usda.gov · package FoodData_Central_sr_legacy_food_csv_2018-04.zip
- Per-food USDA IDs appear in How I calculated it.
Food safety framing (short section only)
- CDC public guidance on poultry pathogens and cooking poultry thoroughly (plain-language food safety).
- FDA public materials on pufferfish / tetrodotoxin risk when preparation is wrong.
What I intentionally did not model
- No day-to-day “meals per Minecraft day” player personas (not measurements).
- No body-weight or body-shape forecasts (wrong genre; not required for the Minecraft question).
- No claim that USDA certifies Minecraft item masses. Only that USDA certifies energy for the real foods I named.